Tips & Tricks: Storm and the Synapse UI
by savage | 2023-06-06
Synapse is a powerful platform designed to "superpower" analysts, and as such, it is packed with capabilities and features. Users can take advantage of these to simplify their tasks, whether they are a new user getting acquainted with the system or a seasoned user streamlining their operations. In this piece, I’ll highlight some key features and capabilities that I like to use to streamline my work.
Storm & the Synapse UI
If you're familiar with Synapse then you've probably heard about its query language, Storm. Designed to be direct, concise, and intuitive, Storm is a language that users can learn as they go, starting out with simpler queries and gradually advancing to more complex and powerful queries as desired. Analysts can also automate Storm queries, creating Cron jobs and Triggers.
Many elements of the Synapse UI run Storm under the hood, giving analysts additional ways to use Synapse to interact with their data beyond running Storm queries in the Query Bar. For example, analysts can use Auto Add mode or the Add Node dialogue to create nodes, right click and use the "add tags" menu option to annotate data, and use the Explore button to pivot out to connected nodes. This makes it especially easy for new Synapse users to start working in the system, while further simplifying many analyst tasks.
However, there are several key differences to keep in mind when it comes to comparing Storm and the Synapse UI. A major one is that Storm gives analysts the power and flexibility to tell Synapse exactly what they want, such as asking a specific question of the data. In contrast, the Synapse UI is running hardcoded Storm operations built into various elements. As a result, analysts may often find that Storm provides a more precise means of working with the data than the Synapse UI.
In the case of The Vertex Project analysts, we take a "best of both worlds" approach, switching between Storm and the UI depending on whichever option is most convenient for our current use case. Sometimes it’s faster and easier to just click the Explore button to pivot through the data, while other times we’ll want to use a Storm query to navigate more precisely. Between Storm and the Synapse UI, we have the option to do both.
Given Storm’s utility, we recommend that analysts make an effort to familiarize themselves with the query language to some extent. There are several different resources that analysts can use, including the APT1 Scavenger Hunt (with accompanying data available on demo instances) and detailed documentation.
Search for and Create Nodes with Lookup Mode
A quick and easy way to search for (and add, if need be) basic indicators is with Lookup mode, which users can access through the Query Bar. Lookup mode is one of several supported modes, the others being Storm, Text-Search, and Auto Add, and supports several basic types of indicators, including hashes (md5, sha1, sha256), FQDNs, IPs, URLs, and email addresses. I can use Lookup mode to quickly check whether several indicators already exist within Synapse by copying and pasting the indicators into the Query Bar and hitting enter to search. If the indicators exist, Synapse will lift the nodes for me, but if they do not, Synapse will show a pop-up giving me the chance to review "suggested node(s) for creation."
The "suggested node(s)" are Synapse’s best guess as to what I’d like to model. I can then click "create" to add the nodes to Synapse, and opt to remove any that I’d prefer not to add. In the example below, I have several hashes and a URL that I’ve copied from a message and want to search for within Synapse. There are also a few filenames, which Lookup mode ignores. Since none of these indicators exist yet within Synapse, Lookup provides several suggestions. I remove an apparent URL that I’d rather not add, and create the other nodes.
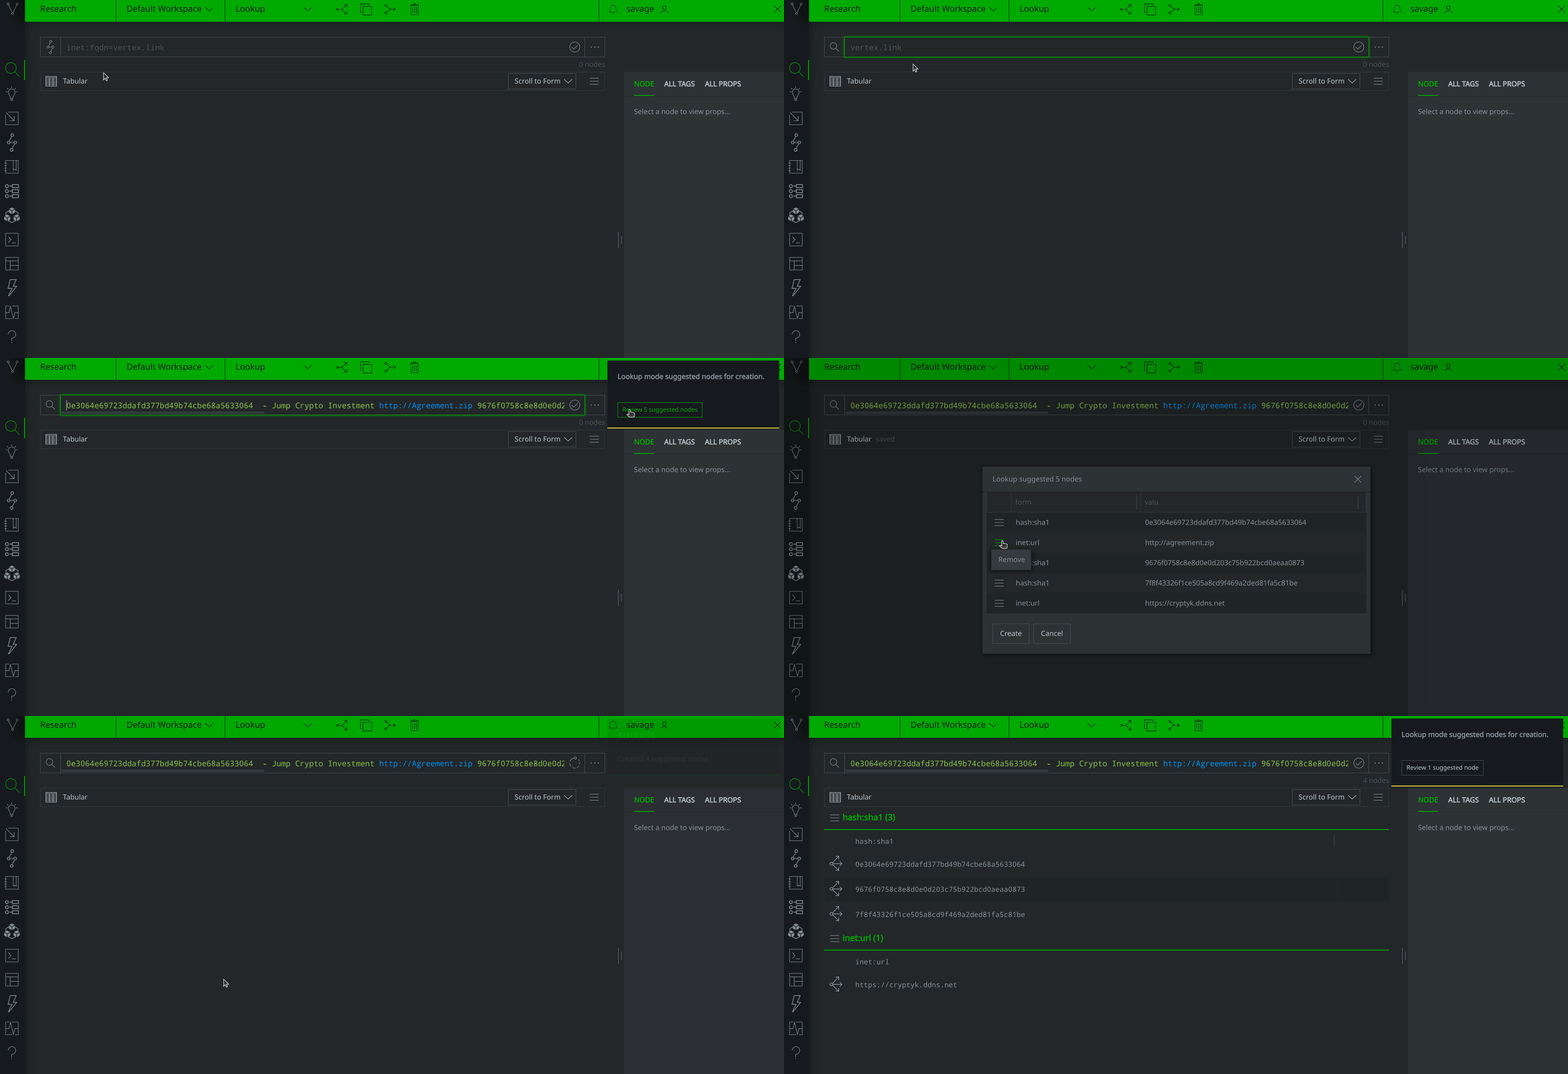
Now that I’ve checked for and created these nodes, I’ll likely want to enrich, pivot from, and tag them. I can continue to use the UI for these tasks if I’d like - right-clicking on nodes and running a Node Action to pull in data from a Power-up, selecting the "add tags" option from the Context Menu, and using the Explore button to pivot. However, I also have the option to use Storm, as I can use the pipe ( | ) command to switch from Lookup into Storm mode for the rest of the query, without going through the Query Bar mode menu. In the example below, I switch to Storm mode to apply an #int.review tag, turning the nodes light blue:
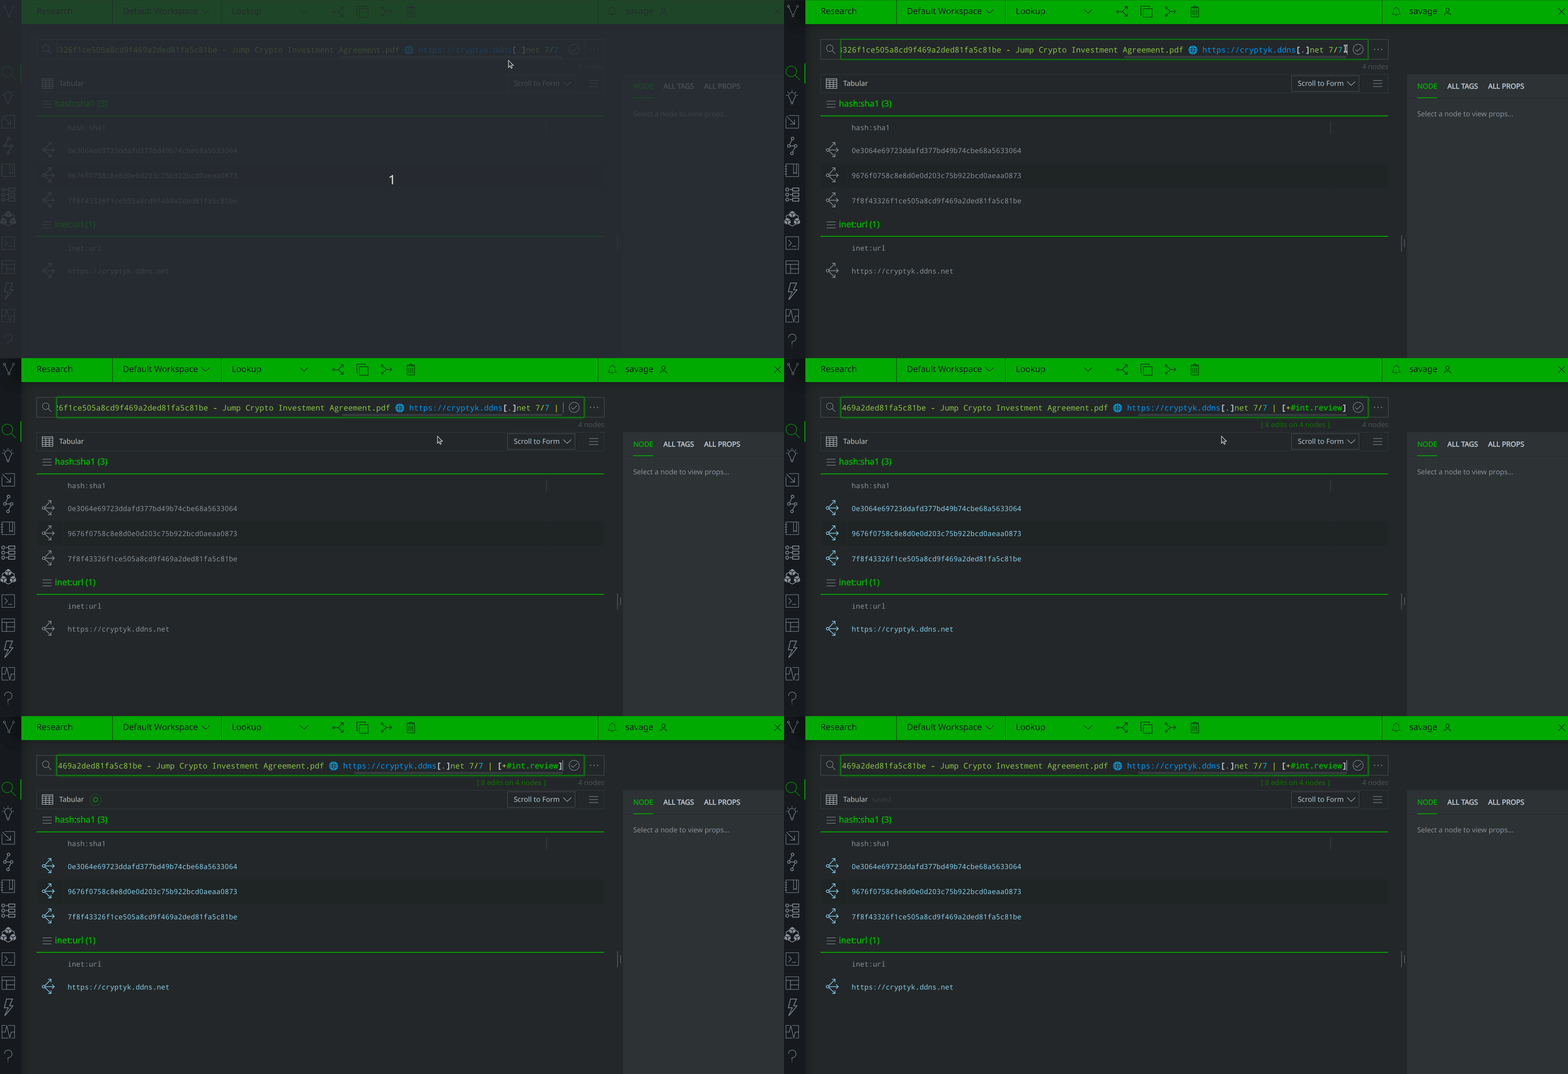
This ability to use Lookup mode and switch back into Storm when convenient is one example of how I might take advantage of Synapse’s flexibility and use the platform in the way that is most convenient for my task at the moment.
Storing Storm Code
Several features that I’ve found to be particularly helpful within the Synapse UI relate to storing bits of Storm code. While we are likely to facilitate most repeat tasks or queries through automation or creating node actions, there are also times in which we might have a query or ingest script that we need occasionally but can’t easily recreate, or see a bit of Storm that a teammate shared and which we might like to eventually use but have no immediate need for. In instances like these, I’ll save it in either the Bookmarks Tool or the Storm Editor Tool.
Bookmarks
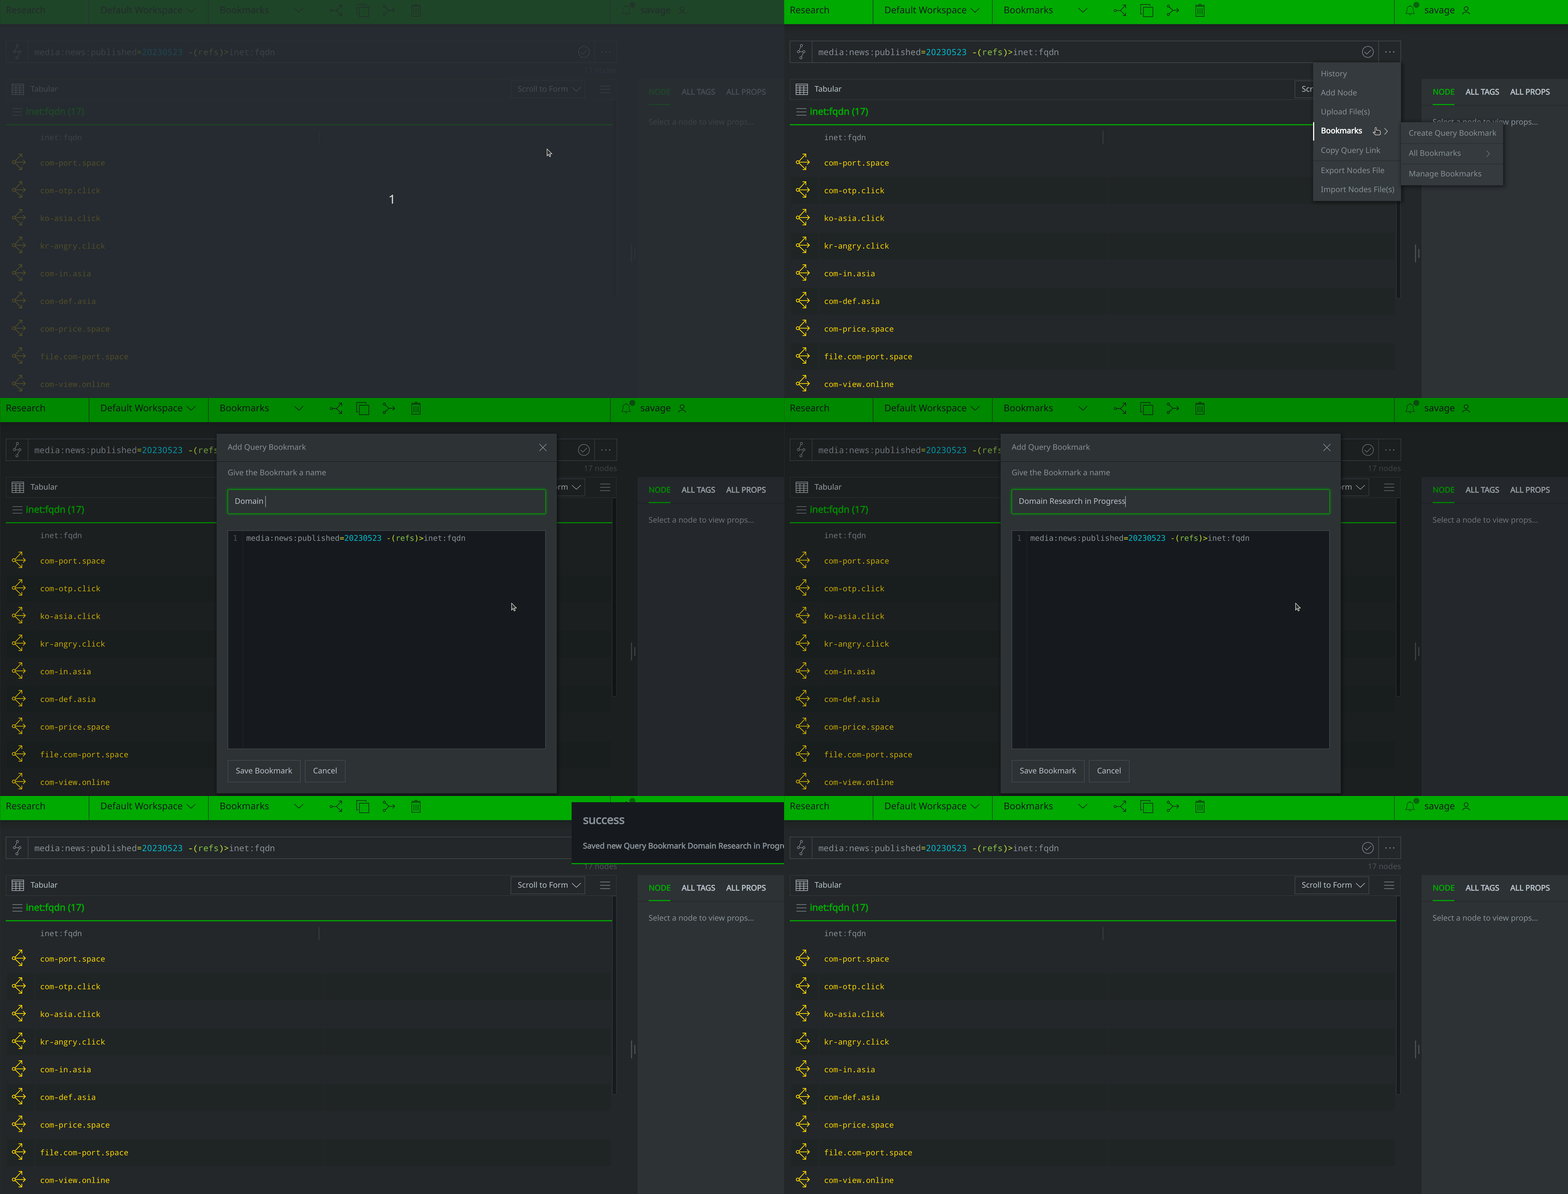
The Bookmarks Tool is accessible through the Query Bar in the Research Tool and Console Tool, and provides a way to save, access, and manage Storm queries. Analysts can create, save, and edit named bookmarks, star favorites, organize them into folders, run them, and copy them to the clipboard. The Bookmarks Tool also supports the use of comments, so analysts can include notes about a particular query. In the example below, I bookmark a query so that I’ll remember to return to the same spot in my research later:
Users can access saved bookmarks through the Bookmarks Tool menu, star favorites, and edit and delete others, as seen below:
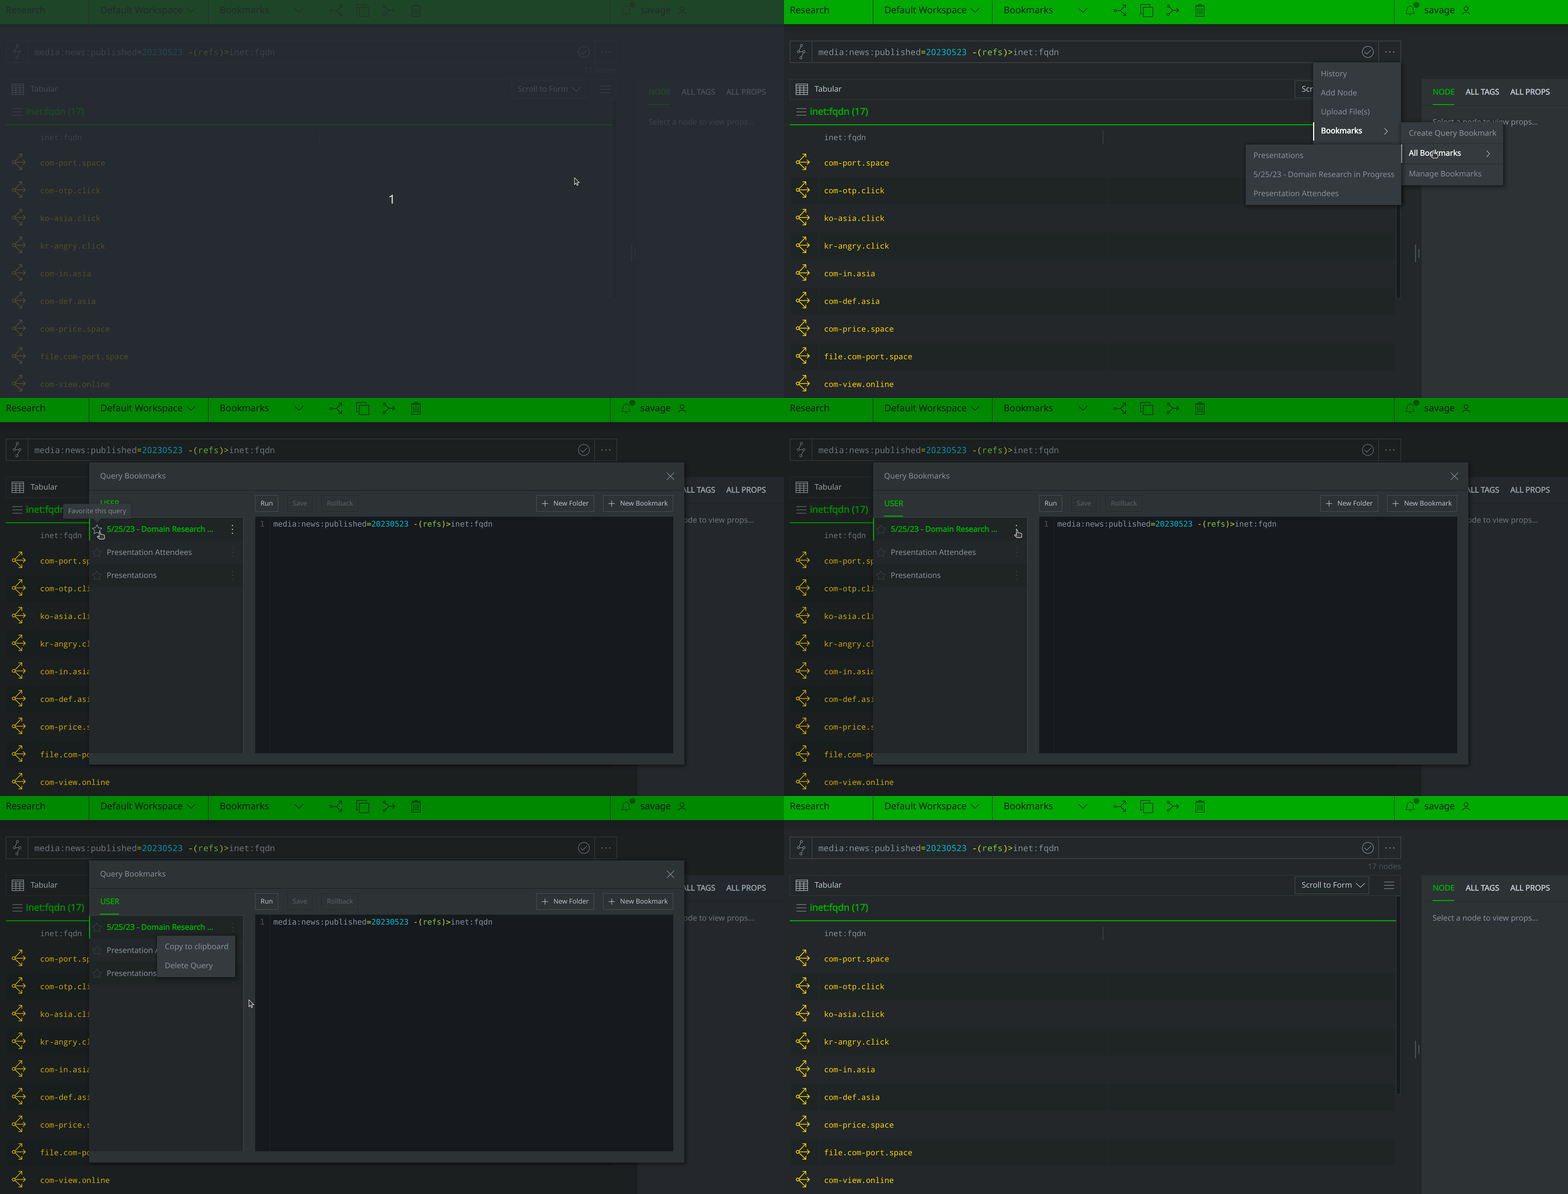
Bookmarks are unique to the user and persist between different Views, which means that I’ll always be able to access my bookmarked queries no matter my current View.
Storm Editor
While analysts can save and organize queries in the easy to access Bookmark Tool, the Storm Editor Tool is better suited for testing (in a forked View!), running, managing, and saving longer Storm scripts and macros. The Storm Editor Tool is divided into two tabs, Queries and Macros. The Query tab, shown below, is where I tend to save Storm scripts for importing data through the Ingest Tool, or performing larger operations such as generating accompanying risk:attack nodes for each inet:email address, which is the query I run below:
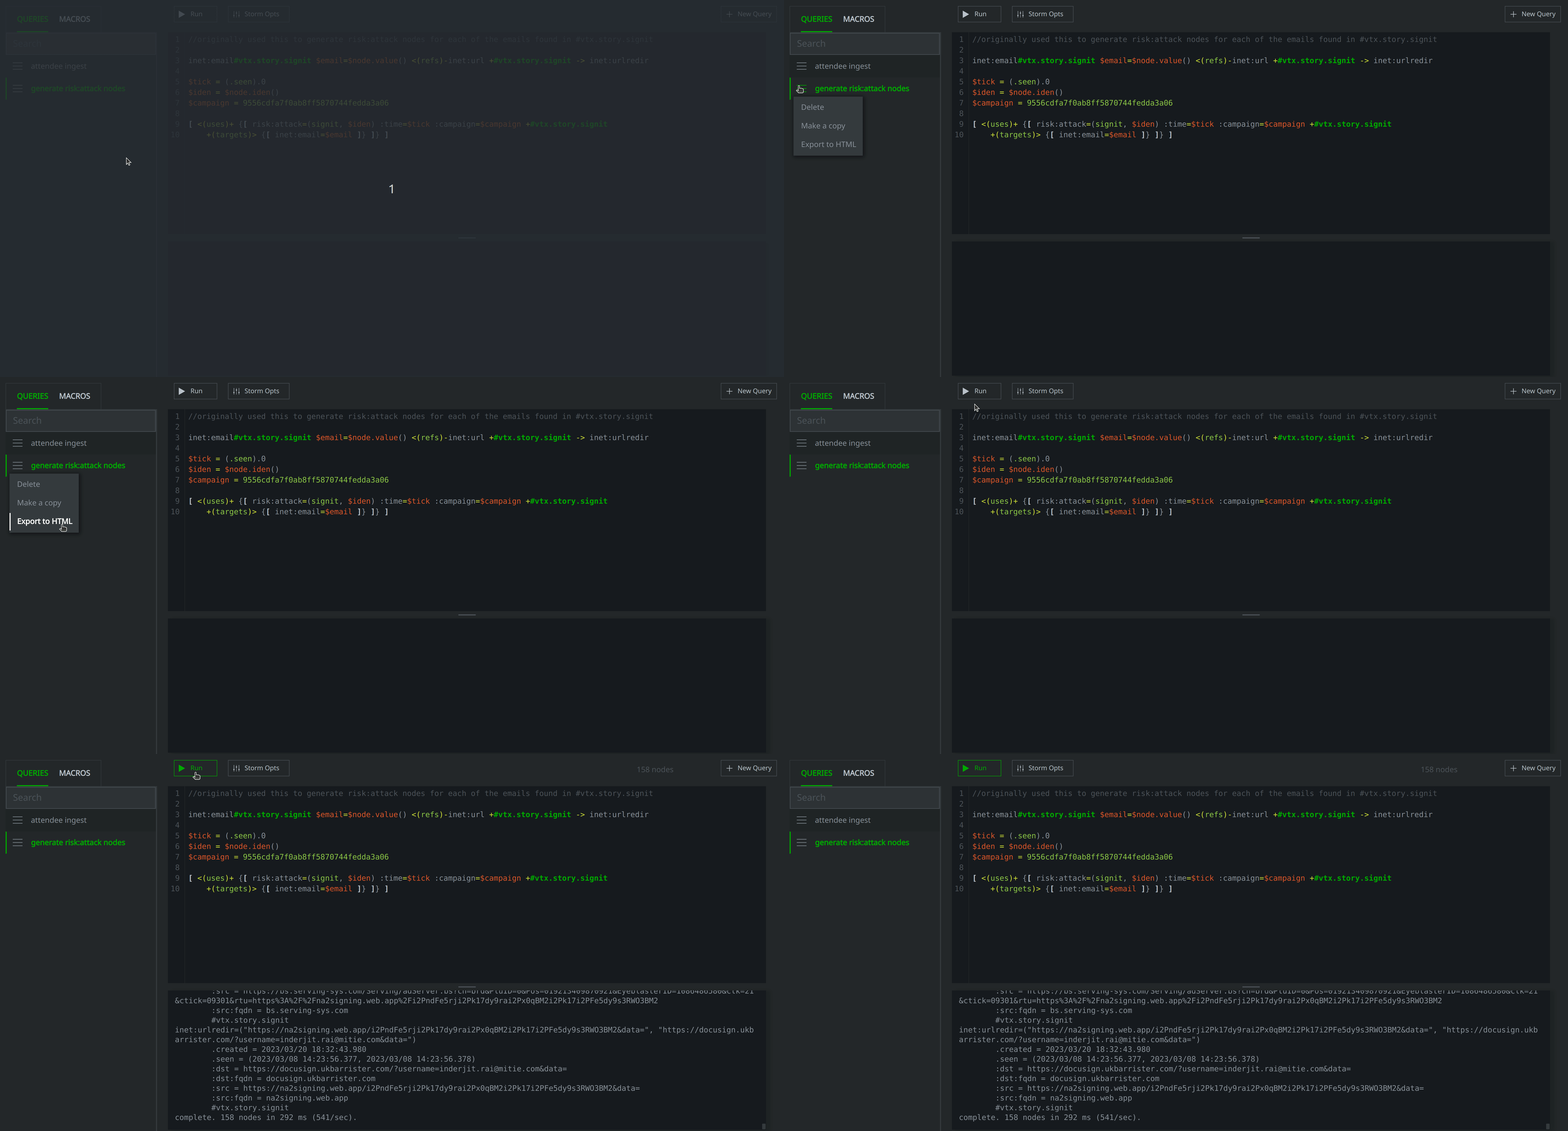
I also store a lot of example queries and scripts - things dropped in chat or that others share - just in case they are useful for something I want to do later or contain elements that I can copy and edit into a query for another task. As with the Bookmarks Tool, queries saved in the Storm Editor Query tab are unique to the user and persistent regardless of which View that user is working out of.
The Storm Editor’s Macros tab is where macros are stored. Given that macros are often used in automation they are shared among users, however, they also remain persistent independent of View like the Query tab and Bookmarks Tool.
Customizing Your Environment with the Workspaces Tool
One thing I recommend all Synapse users do is create a custom Workspace so that they have an analysis environment tailored to their tasks. Some analysts may find it helpful to create several different Workspaces, each designed to support a different type of analysis, such as one for strategic analysis and another for malware research. Individual users can share Workspaces with others, and Synapse administrators can also create and roll out a Global Default Workspace so all users have the same environment settings.
When setting up a Workspace, I typically focus on the following components:
Setting the node property display in Tabular Display mode: In the Research Tool I'll select which node properties I’d like to have displayed for certain forms (particularly those that are guid forms) based on which are most relevant for my analysis. For example, if I will be viewing
it:logonevents, I may want to display the:time,:client:ipv4, and:success properties, and create embed columns to show:creds::userand:host::name.Color coding tag trees: setting color coding rules for tags can help me quickly identify nodes carrying a certain tag. In one of my Workspaces, any nodes tagged with
#cno.threat.*or#cno.malwill show up in magenta. This helps me quickly recognize when I am re-encountering a node that we’ve previously assessed is either part of a threat cluster or malicious.Custom Node Actions: Analysts can create custom Node Actions to easily perform Storm operations from the context menu. Although many Synapse Power-ups automatically create their own accompanying Node Actions, there may be instances in which I’ll want a single Node Action that will run several Power-ups, or the ability to run a command for which there previously was no Node Action. In my malware analysis Workspace, for example, I created a custom Node Action that will run
file:bytesnodes against all YARA rules using the| yara.match command, as that Node Action does not otherwise exist. Other custom Node Actions may run Storm commands or execute macros.
Making Synapse Work for You
The Vertex Project analysts often joke that there are a hundred different ways to do something in Synapse, and, while flexibility and precision contributes to Synapse’s power as a platform, it may seem intimidating to some. However, there are many ways for new users to get started with Synapse, from leveraging the UI to add, tag, enrich and pivot through data to customizing their personal analysis environment through the Workspaces Tool. Other features, such as custom Node Actions, bookmarks, and the Storm Editor Tool provide users with an easy way to create, test, save, and access Storm queries. Synapse is a powerful, but flexible system designed not only to support different use cases and types of analysis, but also a range of users, who can take advantage of Synapse’s different customization options to support their use of the platform.
To learn more about Synapse and its different capabilities and use cases, join our Slack community, check out our videos on YouTube, and follow us on Twitter.
